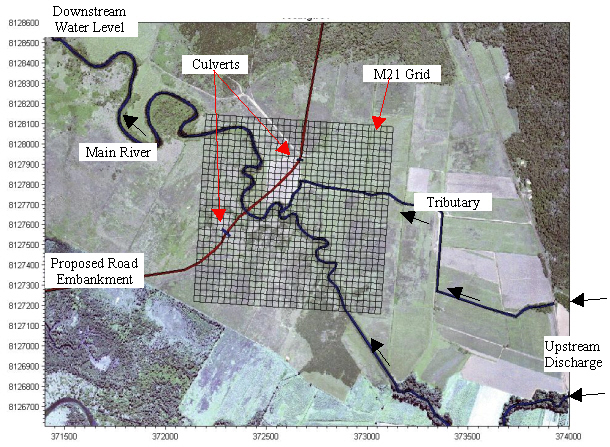
This example is available as a demonstration model to illustrate a real application of MIKE FLOOD using the rectangular grid. The application consists of a flood simulation through a river system. The area of interest is at a confluence with a tributary, where a road embankment has been proposed. Culverts under the road are located on each side of the river.
The river system is represented in MIKE 11. A MIKE 21 grid is inserted into the broader MIKE 11 network to represent flood plain flow, as shown in Figure 9.28:
Figure 9.28 Floodplain Demonstration Layout
· A 5 s time step is used in the simulation and the MIKE 21 grid size is 30 m. The model has been developed with the following MIKE FLOOD links:
· lateral links between the main river channel and floodplain and the tributary and floodplain
· zero flow links along the centre line of the river channel, to ensure that water flows from one side of the floodplain to the other via the main channel
· similarly, zero flow links along the centre line of the tributary
· zero flow links defining the road embankment (assuming that the road does not over top)
· implicit structure links for flow through the culverts
A diagram illustrating the locations of the links is shown:
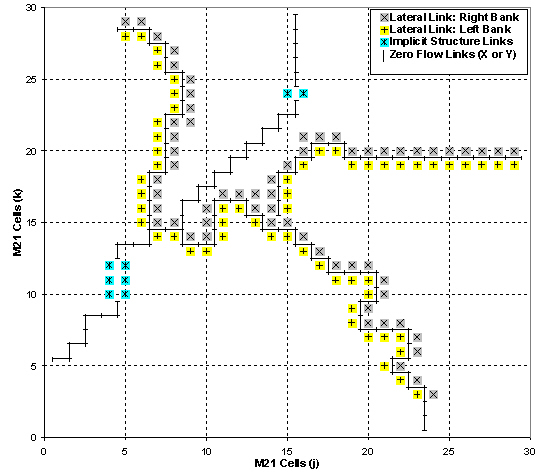
Figure 9.29 Floodplain Demonstration, Diagram of MIKE FLOOD Links
The upstream discharge hydrographs for the river and tributary and the downstream water level boundary condition (which is tidal), are shown below:
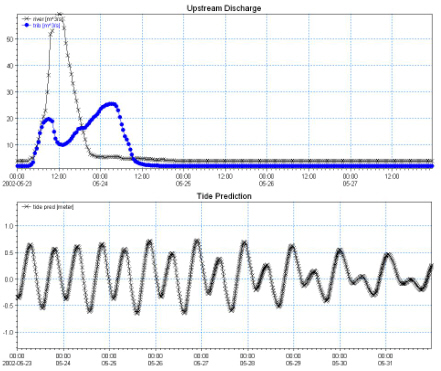
Figure 9.30 Floodplain Demonstration Boundary Conditions
Model results showing water surface contours and velocity vectors near the peak of the flood event are presented in Figure 40. The time series plots in Figure 9.32 show water levels immediately upstream and downstream of the road embankment, and water level difference across the road embankment. Also shown is discharge through the main river channel and through each culvert.
The model results show that for this particular flood event there is a peak 0.36 m head drop across the road embankment. However, the peak head drop at the peak of the flood is 0.16 m. Peak discharge through the main river channel is 44.2 m3/s, which is much higher than the culvert flows of (1.7 m3/s and 3.8 m3/s).
If this model was intended to investigate the hydraulic impacts of the road embankment, a model of the existing situation (no road) could also be performed. Comparing model results with and without the road embankment could give an indication of the likely impacts. Also, the performance of the culverts could be assessed (maybe more are needed?).
Note that this is a demonstration model - not a real example. Other modelling considerations that could be of relevance in this example include:
· The MIKE 21 grid does not cover the entire floodplain width.
· The proposed road crosses over the main channel. Any hydraulic effects (bridge structure or pier losses) created by this situation are ignored.
· The roughness parameter on the floodplain has been set to a constant value of M=20. The roughness may actually be varying spatially, particularly if there are a range of land use patterns.
· The upstream and downstream MIKE 11 branches only represent the main channel. They do not include the flood plains.
The flood plain example is also available as a flexible mesh version. Note that the flexible mesh version does not have zero-flow links available since these may easily be accomplished through the use of internal closed boundaries. The latter has also been done for the flood plain example to model the road cutting through the flood plain.
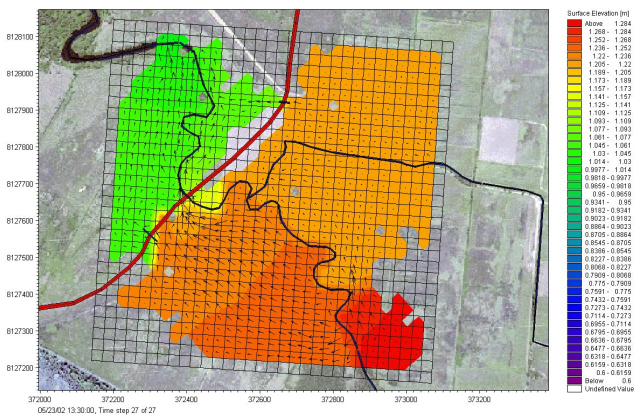
Figure 9.31 Floodplain Demonstration, Water Surface and Velocities near peak of flood
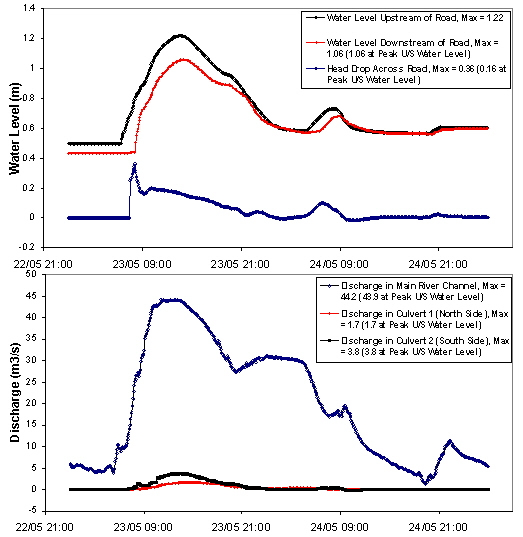
Figure 9.32 Flood plain Demonstration Results - Water Levels and Flows at Road Embankment
![]()