Results
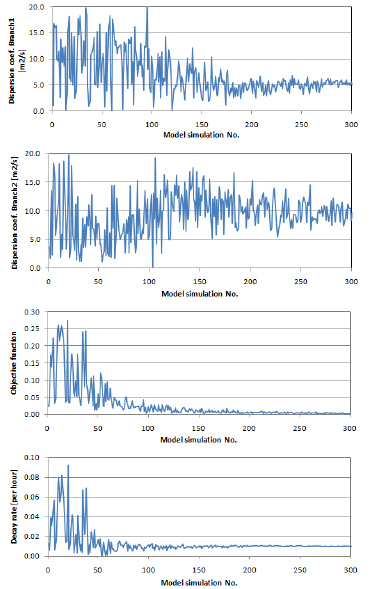
The results of the auto-calibration are shown in the plots in Figure 2.3. It is seen that the two dispersion coefficients and the decay rate are calibrated to the expected values.
Figure 2.3 Result from auto calibration