Results
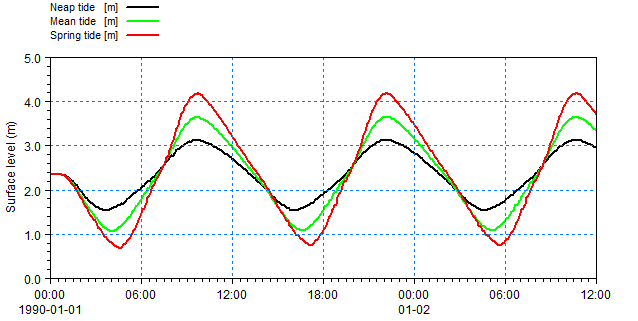
After running the scenarios the elevation output file from each scenario is used to plot the water levels shown in Figure 2.7.
Figure 2.7 Resulting water level in reference point for the three scenario runs.