Biological degradation, radioactive decay or other kinds of attenuation of solutes can often be described as a first-order degradation process, with an exponential decrease of concentration over a half-life. This is described in MIKE SHE as
(34.11)
where mref is the reference degradation rate coefficient calculated by
where l is the half-life of the species.
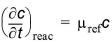
Following the work of Boesten and van der Linden (1991), to overcome some of the difficulties in simplifying complex biological and chemical reactions, the decay in MIKE SHE is dependent of the soil moisture content and soil temperature as
(34.13) 
where the Fw is the water content function given as
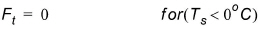
and where q is actual soil moisture, qs is saturated moisture content and B is an empirical constant. Ft is the soil temperature function given as:
(34.16) 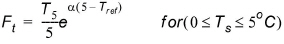
(34.17) 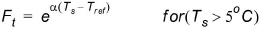
where Ts is the actual temperature of the soil, Tref is the reference temperature at which mref is measured and a is a constant depending on T, Tref, the gas constant and the molar activation.
For simplicity the soil temperature over depth is calculated as a function of the air temperature by an experimentally derived formula given by Klein (1995)
(34.18) 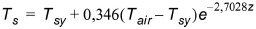
where Tsy is the mean daily soil temperature from yesterday, Tair is the mean daily air temperature and z is depth.
Note that for large depths, this function responds very slowly to variations in air temperature. Therefore, long simulations may be necessary to achieve the required initial temperature distribution. An example of simulated soil temperature distributions as a function soil depth is shown in Figure 34.4.
MIKE SHE allows you to specify separate half-lives for the matrix and fractions in dual porosity models, since degradation is likely to be faster in the fractures where higher oxygen contents are more likely.
.
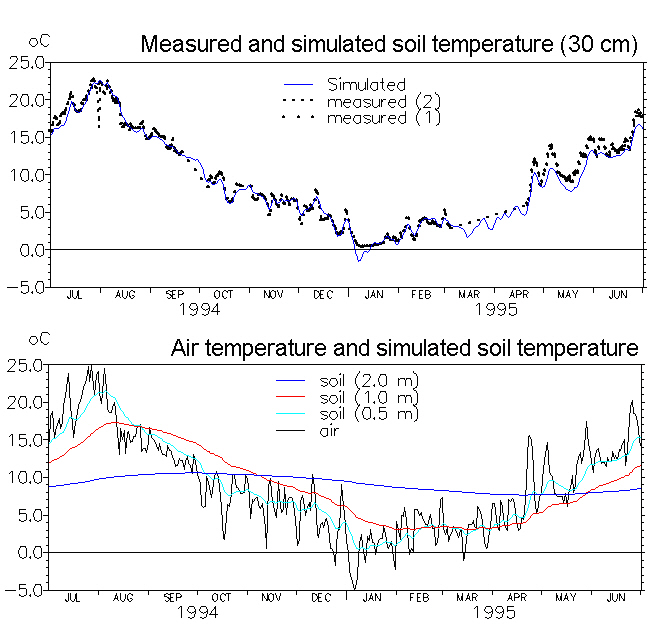
Figure 34.4 Application of the soil temperature function. Top: measured and simulated soil temperature in 30 cm depth (measurements were based on two replicates). Bottom: soil temperatures simulated in different depths based on measured air temperatures.
![]()