Evapotranspiration Coefficients C1, C2 and C3
The equations for actual transpiration, Eq. (20.4), and soil evaporation, Eq. (20.9), contain three empirical coefficients, C1, C2, and C3. The coefficients C1 and C2 are used in the transpiration function, f1(LAI) (Eq.(20.5)). C3 is also part of Eq. (20.4), but is only found in the soil moisture function, Eq. (20.6).
C1
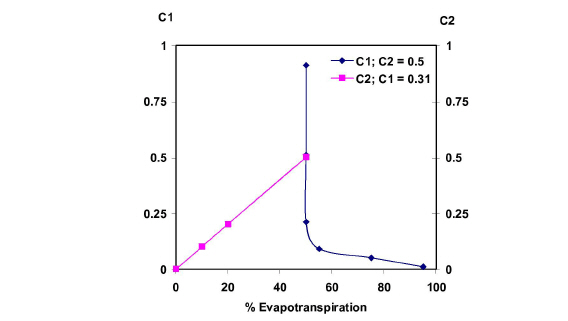
C1 is plant dependent. For agricultural crops and grass, C1 has been estimated to be about 0.3. C1 influences the ratio soil evaporation to transpiration. This is illustrated in Figure 20.7. For smaller C1 values the soil evaporation becomes larger relative to transpiration. For higher C1 values, the ratio approaches the basic ratio determined by C2 and the input value of LAI.
C2
For agricultural crops and grass, grown on clayey loamy soils, C2 has been estimated to be about 0.2. Similar to C1, C2 influences the distribution between soil evaporation and transpiration, as shown in Figure 20.8. For higher values of C2, a larger percentage of the actual ET will be soil evaporation. Since soil evaporation only occurs from the upper most node (closest to the ground surface) in the UZ soil profile, water extraction from the top node is weighted higher. This is illustrated in Figure 20.8, where 23 per cent and 61 per cent of the total extraction takes place in the top node for C2 values of 0 and 0.5 respectively.
Thus, changing C2 will influence the ratio of soil evaporation to transpiration, which in turn will influence the total actual evapotranspiration possible under dry conditions. Higher values of C2 will lead to smaller values of total actual evapotranspiration because more water will be extracted from the top node, which subsequently dries out faster. Therefore, the total actual evapotranspiration will become sensitive to the ability of the soil to draw water upwards via capillary action.
C3
C3 has not been evaluated experimentally. Typically, a value for C3 of 20 mm/day is used, which is somewhat higher than the value of 10 mm/day proposed by Kristensen and Jensen (1975). C3 may depend on soil type and root density. The more water released at low matrix potential and the greater the root density, the higher should the value of C3 be. Further discussion is given in Kristensen and Jensen (1975).
Figure 20.7 The influence of the C1 and C2 on the ratio between soil evaporation and transpiration. The values were obtained from model runs assuming Cint = 0, the moisture content above field capacity, and LAI = 5
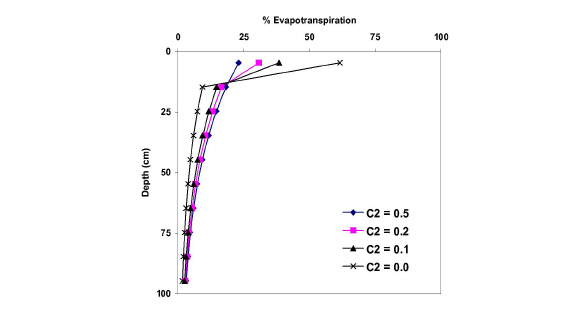
Figure 20.8 Distribution of actual evapotranspiration (in per cent) over depth for different values of C2. C2=0 corresponds to pure transpiration.
![]()