Run statistics is a summary of the run statistics for the MIKE Hydro River and MIKE SHE detailed time series. The statistics are generated in HTML and shape file format. The calculations include all the detailed time series items that have observation data.
To calculate Run Statistics for a simulation, select the period you want to summarize, then click on the Generate Statistics button. For some simulations with long simulation periods and/or a lot of calibration data it can take several minutes to generate the run statistics.
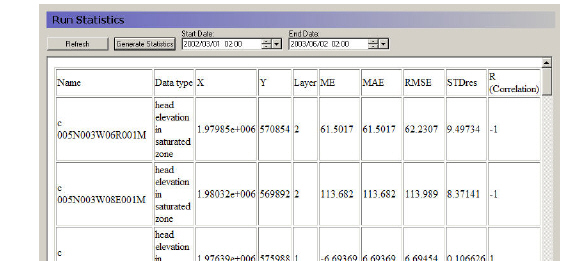
The Run Statistics are displayed in HTML format on the Run Statistics page (see below).The HTML table can be copied and pasted directly into Microsoft Word or Excel.
Similar to the detailed time series output, the Run Statistics can be viewed during a simulation. Press the Refresh button on the Run Statistics page to update the Run Statistics using the most recent model results during a simulation
Shape file output for run statistics
A shape file of statistics is also generated when the HTML document is generated. The shape file contains all of the information contained in the HTML document and can be used to generate maps of model errors that can be used to evaluate spatial bias. The shape file is created in the simulation directory and is named projectname_Stat.shp where SimulationName is the name of the *.she file for the simulation. Note: the Run Statistics shape file does not have a projection file associated with it. This file must be created using standard ArcGIS methods.
![]()