The statistics contained in the HTML document and the shape file are calculated using the same methods used to calculate statistics for the detailed time series output.
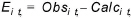
The standard calibration statistics calculated based on the differences between the measured observations and the calculated values at the same location and time. Thus, the error, or residual, for an calculation - observation pair is
(14.1)
where Ei,t is the difference between the observed and calculated values at location i and time t.
Mean (ME)
The mean error at location i where n observations exist is
(14.2) 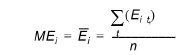
Mean Absolute Error (MAE)
The mean of the absolute errors at location i where n observations exist is
(14.3) 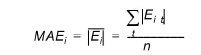
Root Mean Square Error (RMSE)
The root mean square error at location i where n observations exist is
(14.4) 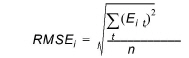
Standard Deviation of the Residuals (STDres)
The standard deviation of the residuals at location i where n observations exist is
(14.5) 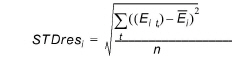
The standard deviation is a good measure to evaluate how well the dynamics of a certain observation are simulated.
Correlation Coefficient (R)
The correlation coefficient is a measure of the linear dependency between simulated and measured values. The closer the value is to 1.0, the better the match. The correlation coefficient at location i is
(14.6) 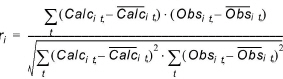
where  and
and  are the means of the observations and calculations at location i respectively.
Nash Sutcliffe Correlation Coefficient (R2)
The Nash-Sutcliffe coefficient at location i where n observations exist is
(14.7) 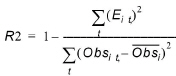
where  is the mean of the observations at location i. R2 will be 1.0 if there is a perfect match.
![]()