Hydraulic Conductivity Function
The Governing Equation for the unsaturated flow requires information about two hydraulic functions: The hydraulic conductivity function, K(q) and the soil moisture retention curve y(q) are important.
The hydraulic conductivity decreases strongly as the moisture content q decreases from saturation. This is not surprising since the total cross-sectional area for the flow decreases as the pores are getting filled with air. In addition, when a smaller part of the pore system is available to carry the flow, the flow paths will become more tortuous. Also, there is an increase of the viscosity of the water, when the short range adsorptive forces become dominant in relation to the capillary forces.
The experimental procedure for measuring the K(q) function is rather difficult and not very reliable. Alternatively procedures have been suggested to derive the function from more easily measurable characterizing properties of the soil or simply to rely on empirical relationships.
Reviews of various methods for predicting the conductivity function can be found in the literature.
Tabulated
The data points describing the pressure conductivity curve can be given as a table of pF versus K values. The table should be specified starting with the lowest value of pF (wettest condition) and given in increasing order of pF.
To get a smooth hydraulic conductivity curve, MIKE SHE adopts a cubic spline curve fitting procedure. As a minimum, you should specify the conductivity at saturation, the field capacity and the wilting point. However, we strongly advise against this because the cubic spline function is unlikely to be able to fit an appropriate function to only 3 points.
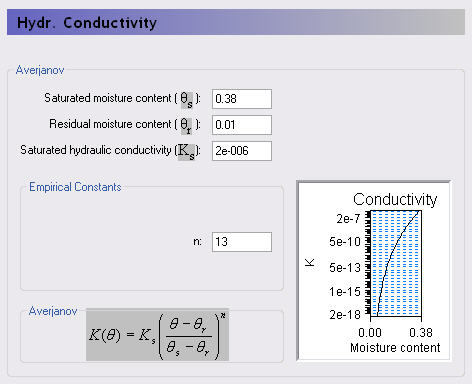
In the Averjanov method, the hydraulic conductivity, K, is described as a function of the effective saturation, Se:
(18.3) 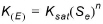
where
(18.4) 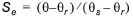
in which qs, q and qr are saturated, actual and residual moisture contents, respectively.
The full knowledge about the hydraulic conductivity function is seldom available, and the parameter n has to be estimated by calibration.
As a guideline the exponent n is usually small for sandy soils (2-5) and large for clayey soils (10-20). It is important to note that the value of the exponent n will influence the percolation rate in the soil and thereby influence the actual evaporation rate.
Note It is important to note that the data is tabulated internally and stored in the same form as if tabulated data were input using about 100 points.
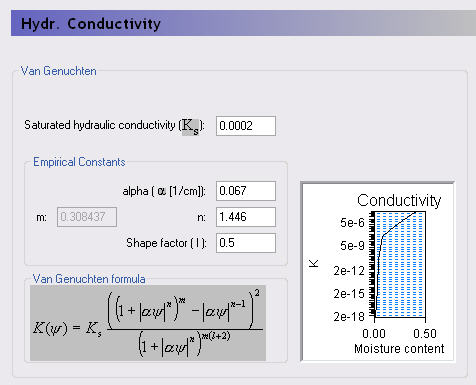
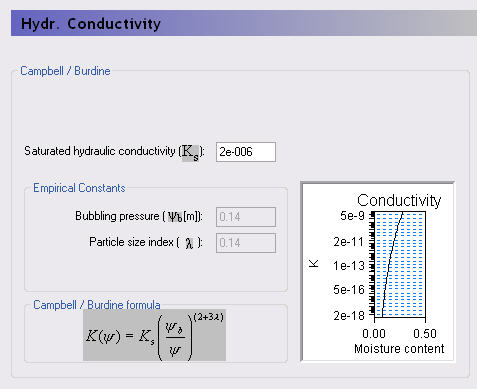
In addition to the tabulated values, parametric functions are available using the Van Genuchten and the Campbell/Burdine formulations. It is important to note that the data is tabulated internally and stored in the same form as if tabulated data were input.
The van Genuchten Shape Factor, l, is soil texture dependent, with a minimum allowed value of -4.
Note It is important to note that the data is tabulated internally and stored in the same form as if tabulated data were input using about 100 points.
Note It is important to note that the data is tabulated internally and stored in the same form as if tabulated data were input using about 100 points.
![]()