 . Clicking on this icon will allow you to interactively define a cross-section by left-clicking at each vertex of the profile line and double-clicking to close the profile.
Saturated Zone Cross-section Plots
To display a cross section plot of a set of 3D gridded data, you must click on the Profile icon, . Clicking on this icon will allow you to interactively define a cross-section by left-clicking at each vertex of the profile line and double-clicking to close the profile.
After closing the profile, the following dialogue will be displayed listing the available output items.
. 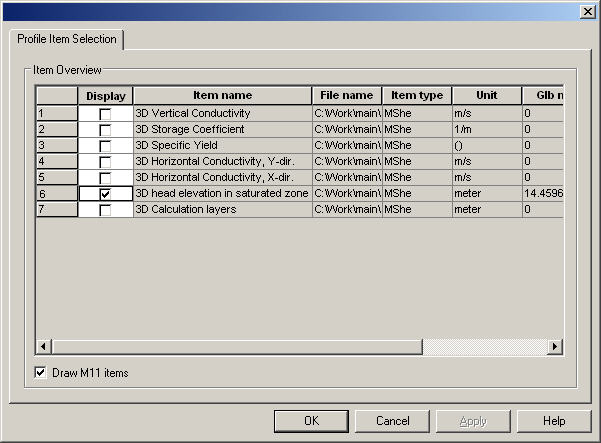
Only one output item can be selected. After selecting your item, click OK and the profile will be displayed.
You can modify the plot by right clicking on the plot and selecting Properties form the pop-up menu.
![]()