Interpolation can be performed on any time series type (e.g. instantaneous, accumulated, step accumulated, mean step accumulated, etc.), but the utility was developed having mainly in mind instantaneous time series data.
Figure 20.1 outlines the parameters needed for interpolating the value in point A.
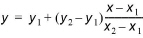
The linear interpolation basically takes two consecutive points and draws a straight line between them. Furthermore, this procedure is performed to each pair of consecutive points within the output period as shown below. This set of straight lines contains all interpolated values for the output time series. The formula for linear interpolation is:
(20.1)
The piecewise cubic interpolation takes four consecutive points, and perform an interpolation by a cubic polynomial between the two central points (out of the four consecutive points). By performing a cubic interpolation, it is possible to smooth the interpolated function with respect to the linear interpolation. Drawing a line passing through the four interpolated points you see a curve following the trend of the data variation.
The formulas for piecewise cubic interpolation are:
(20.2) 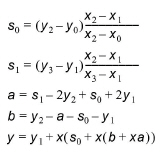
Figure 20.1 Definition of interpolation components
Solid line: result of linear interpolation
Dotted line: result of piecewise cubic interpolation
![]()