The purpose of this example is to illustrate how to generate a map with spatially and temporally distributed data. The generated map may be used in connection with modelling rainfall runoff in a mountain region.
Model input
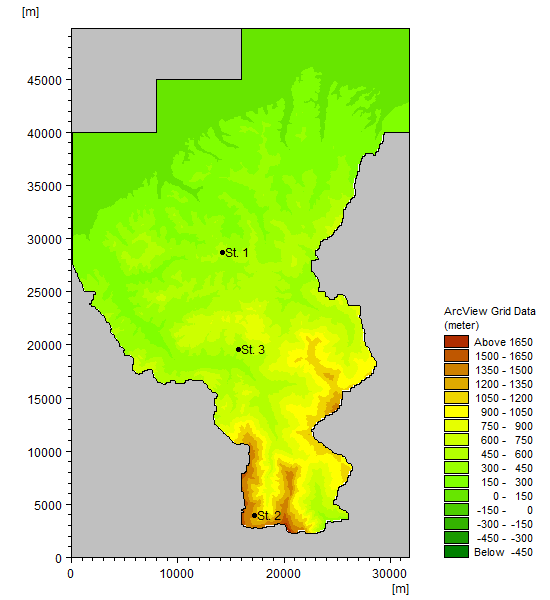
The selected area is as displayed in Figure 22.3. Rainfall data has been collected from three stations in the region and syncronised to a common equidistant calender reference.
Figure 22.3 Selected area. Points indicate location of stations with rainfall data.
Parameters
Two setups are created using Thiessen polygons and Inverse distance method, respectively, to create the map. The output type is selected as spatially and temporally distributed data saved every hour during the first 50 hours of the rainfall event.
Results
The generated rainfall maps are shown in Figure 22.4.
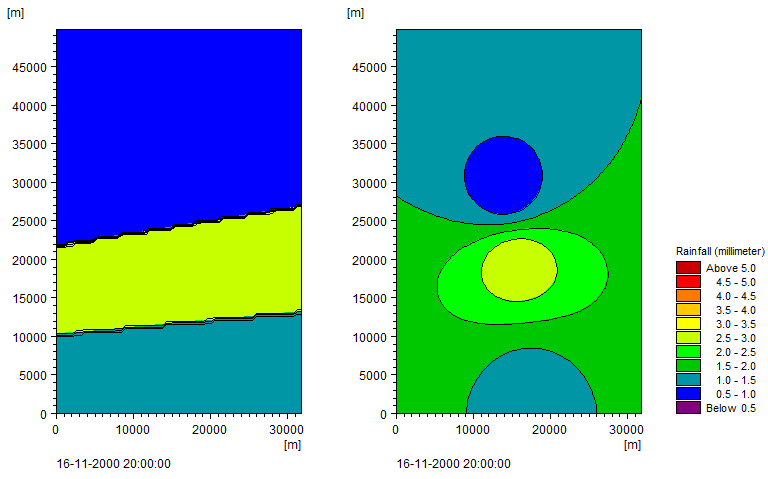
Figure 22.4 Example of resulting rainfall maps for a certain time step.
Left: Created using Thiessen polygons
Right: Created using Inverse distance method
![]()