The Thiessen polygon method assigns the value of any point to the measured value from the nearest measuring station. If this station does not contain values at the specific time step then the nearest measuring with actual data will be used instead.
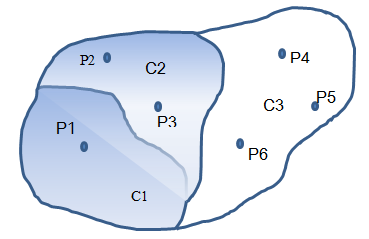
Figure 22.1 Three catchments (polygons) with a number of stations within each.
The calculation of Thiessen polygon is confined to only take place within the individual catchment. Thus in the above figure the average value within catchment C3 is only affected by the values at the stations P4, P5 and P6. The area of interest is the non-shaded part. The Thiessen polygons for catchment C3 are illustrated below with the area of influence of station point P4 as further been shaded.
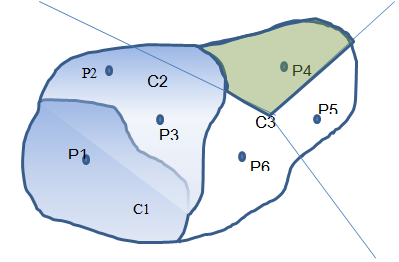
Figure 22.2 The Thiessen polygon associated with point P4 within Catchment C3.
The value v at any point may be written as
(22.1) 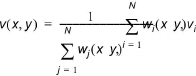
where N is the number of stations. The weighting values in the case of Thiessen polygons are unity or zero where unity is used for the nearest station and zero for the remaining.
To obtain an average value for the whole catchment the above equation is integrated over the whole catchment and divided by the catchment area i.e.
(22.2) 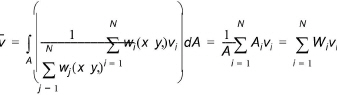
Thus the weights for calculating the mean area weighting value per catchment is given by
(22.3) 
where the index i refers to the station.
![]()