The following figures describe the process and result when you sort a time series file containing a wave climate where each event is defined by an individual duration.
Consider a case where a harbour experience severe seiching for waves with wave periods above 10 s that comes from SE (120 degrees -150 degrees). By sorting the available data using only 2 items and relevant class intervals it is possible to easy determine how often the seiching will occur.
The results in Figure 23.15 shows that during a total period of 35064 hours, expressed by 11333 time steps in the input time series, seiching will occur only during 7 hours, i.e. for 0.02% of a year.
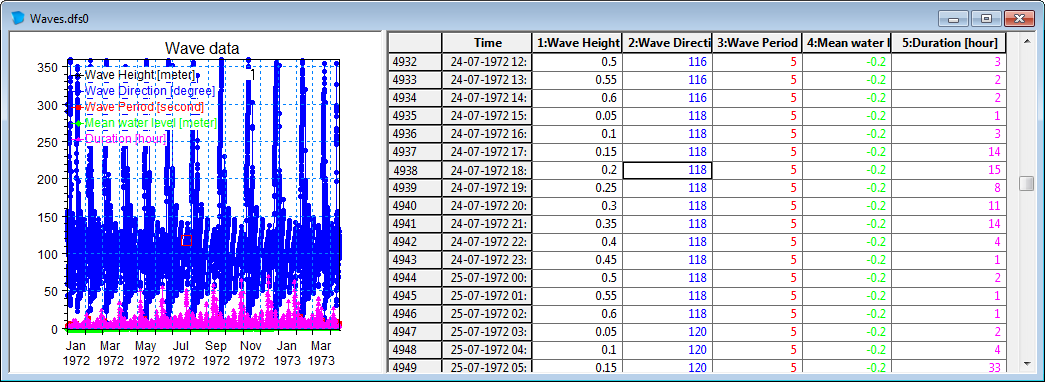
Figure 23.9 Individual wave events with varying duration
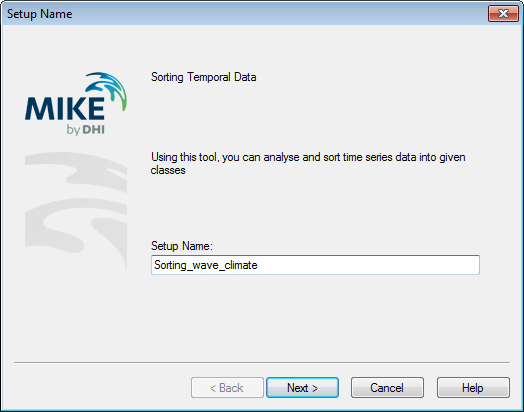
Figure 23.10 Specify name for setup
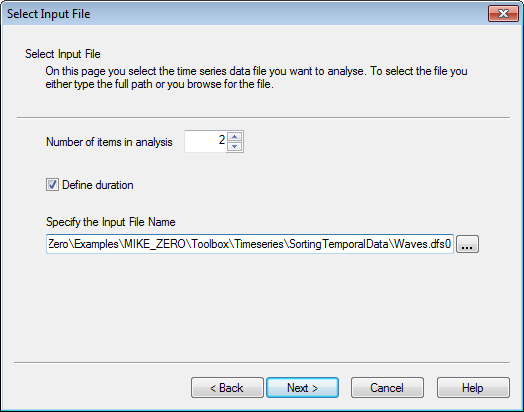
Figure 23.11 Define number of items in analysis, enable duration and select input file and input items
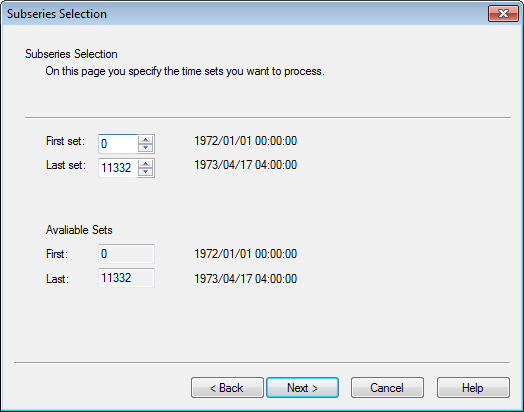
Figure 23.12 Specify subseries
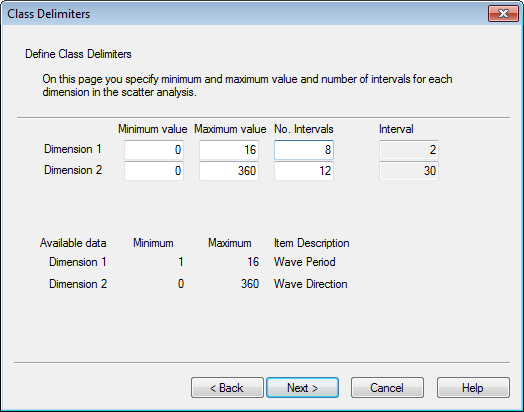
Figure 23.13 Specify class dimension and intervals for sorting
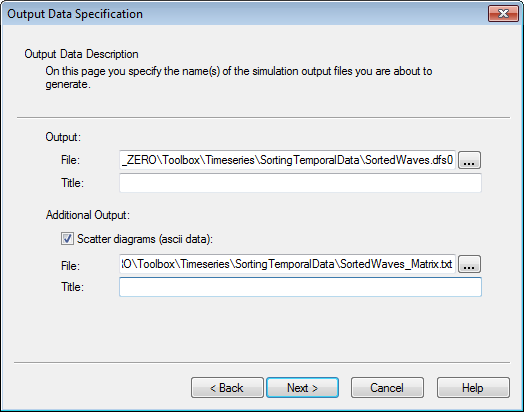
Figure 23.14 Specify output file names
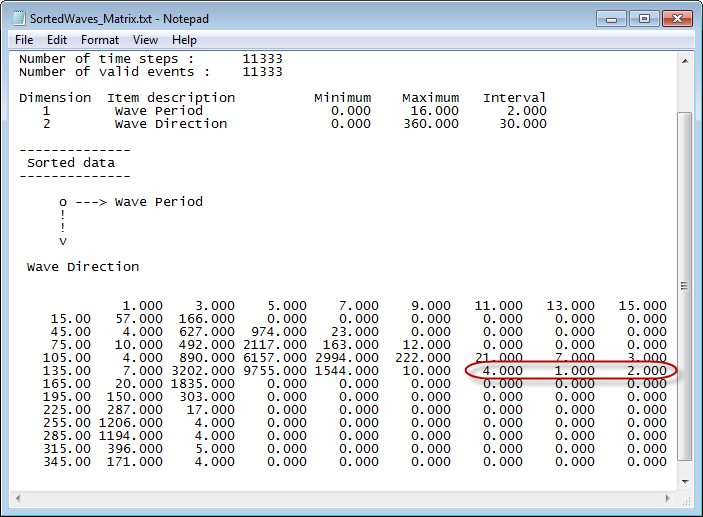
Figure 23.15 Resulting ascii output file.
Note: emphasized values are number of hours where seiching occur.
![]()