The following figures describe the process on how to sort data from wind measurements where all the events has the same duration.
The aim of the processing is to sort the data into classes.
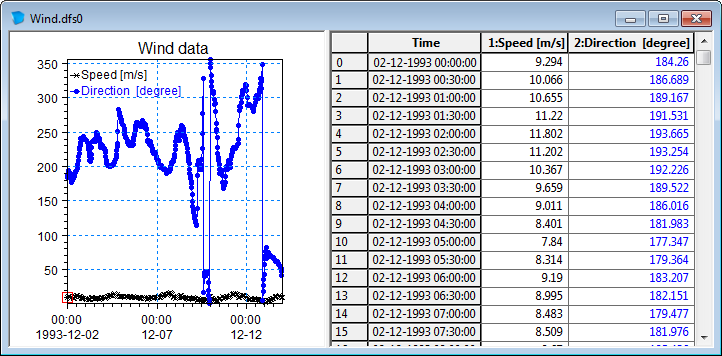
Figure 23.1 Input wind measurements
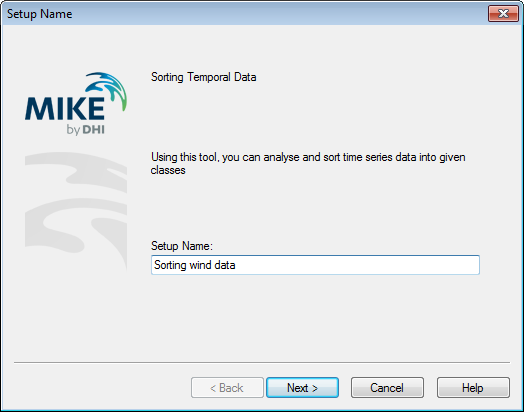
Figure 23.2 Specify name for setup
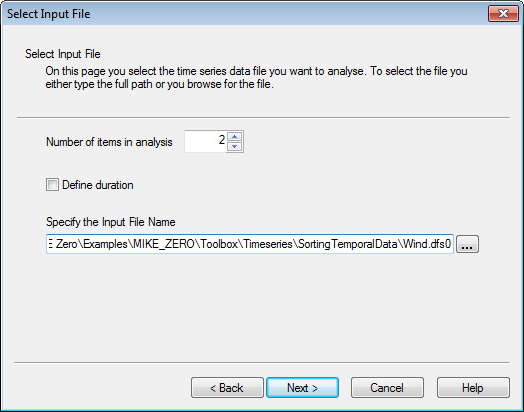
Figure 23.3 Define number of items in analysis, select input file and both input items
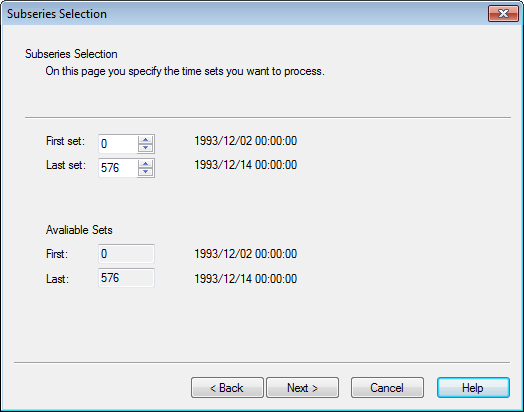
Figure 23.4 Specify subseries
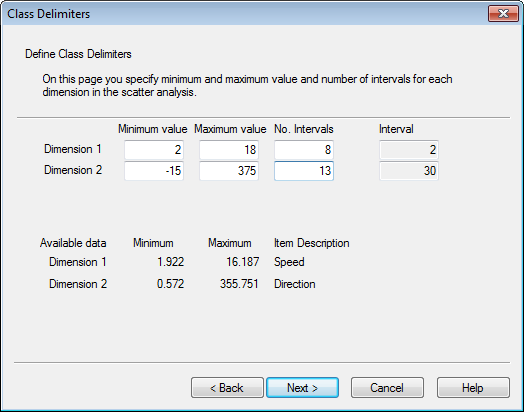
Figure 23.5 Specify class dimension and intervals for sorting
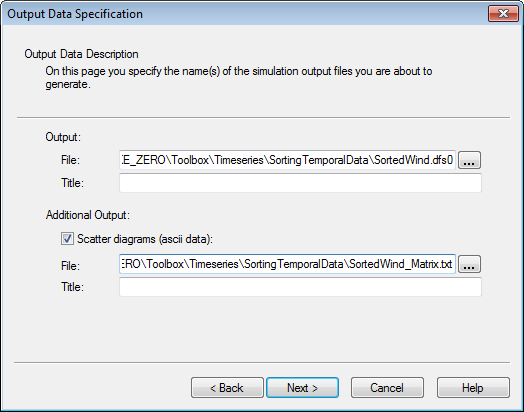
Figure 23.6 Specify output file names
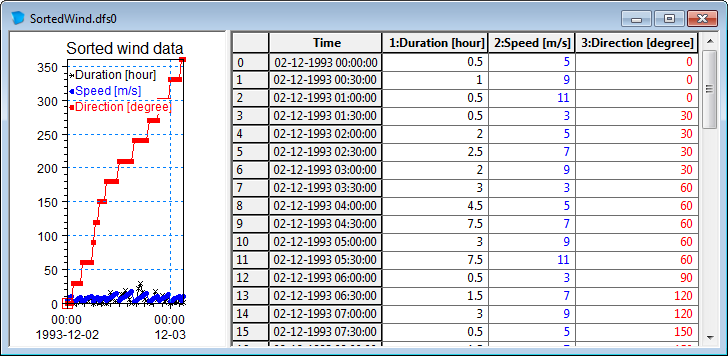
Figure 23.7 Resulting output time series file
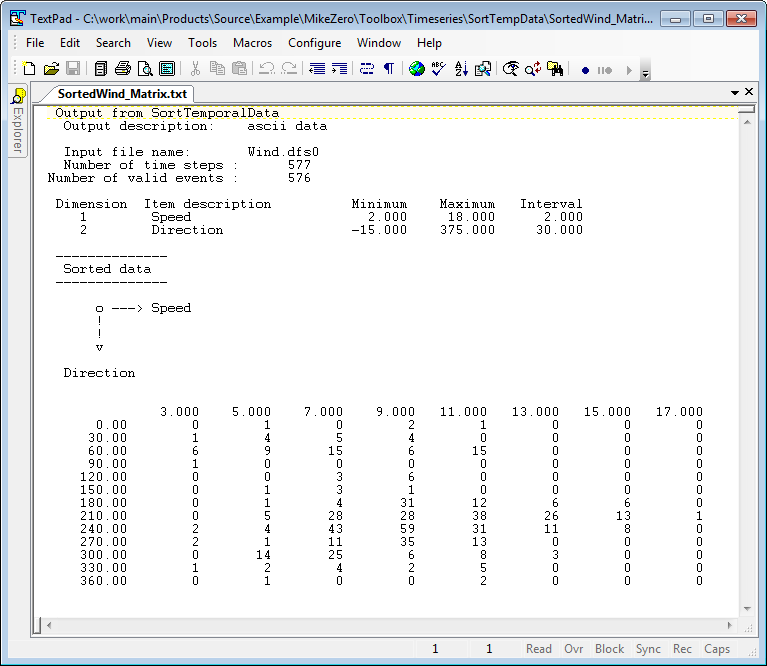
Figure 23.8 Resulting ascii output file
Note: one of the events was deemed invalid because the wind speed was below the minimum value of 2 m/s.
![]()