The auto generate cross section tool offers options to define and extract cross sections either from a Digital Elevation Model (DEM) or from survey points.
The elevation from the cross section can be taken either from a DEM or from survey points.
DEM
To generate cross sections from a DEM first activate the DEM radio-button. Cross sections will be generated along the selected branch. The following options are available:
· Equidistant interval and Width:
Interval: Equidistant distance between cross section to be generated.
Width: This defines the width of the generated cross sections. Cross section lines will be located with half of the width distance on each side of the river centre line.
The cross sections will be created with a resolution in each cross section corresponding to the options specified in the ‘Digital Elevation Model’ menu.
· Location from shape file: Use a shape file containing cross section polylines at the requested locations along the rivers in the model. Select the shape file to be used in the drop-down list of shape files.
Cross sections will only be generated where shape file geometries intersects with the selected branch. The cross section will be generated as a straight line from the first to the last point in the line shape.
It is possible to automatically assign an ID to each generated cross section, by activating the option ‘Apply cross section ID’. This ID is obtained from the shape file’s attribute selected in the ‘Field’ menu.
Note: Usage of shape files requires that they are specified in the ‘Background layers’ before opening the tool.
· Use bilinear interpolation: If ‘Use bilinear interpolation’ is checked bilinear interpolation is used when extracting cross section z-values from the DEM cells. If unchecked the z-value in the cross section profile will be the exact value from the DEM cells that are intersected, whereas if bilinear interpolation is used, z-values will be the interpolated z-value from the 4 closest neighbouring DEM grid cells.
Survey points from shape file
To generate cross sections from a shape file with survey point first activate the ‘Survey points from shape file’ radio-button.
Select a shape file with survey points from the drop-down menu and specify the following:
· Z-value field: Select the attribute in the shape file that contains the elevation.
· Cross section ID field: Select the attribute in the shape file that connects the individual survey points to a specific cross section. All survey points with the same ID field will be created as one cross section.
Note: Usage of shape files requires that they are specified in the ‘Background layers’ before opening the tool.
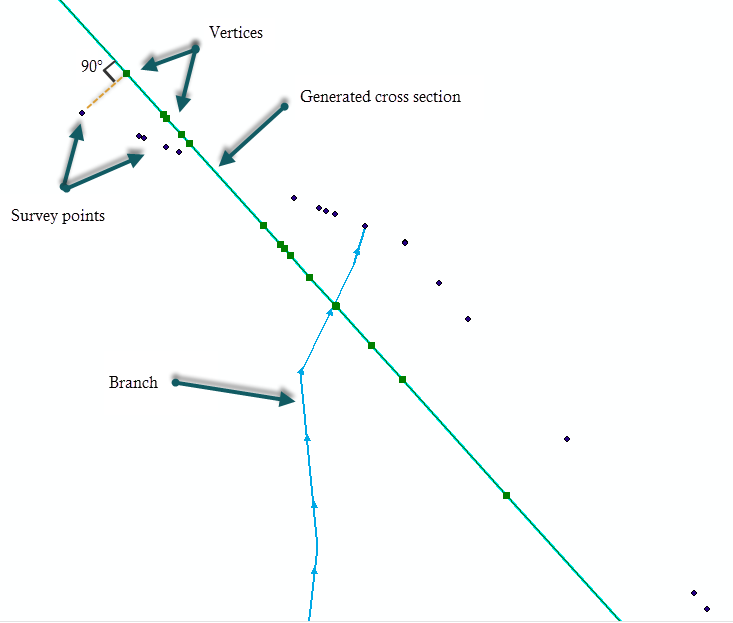
The cross section will be created as a straight line through the connected survey points using a least square fit. The individual survey points are projected orthogonal on to the cross section line see Figure 16.7.
Figure 16.7 Survey points are projected to the cross section
Options selected here control on which branches or parts of branches the new cross sections should be generated. Three options are available:
· All branches: New cross sections may be generated on all branches. In this case, it is not possible to control the range of chainages to be processed on the branches, i.e. the tool will process all branches in their entirety.
· Selected branches: New cross sections may be generated only on the selected branches. In this case, it is not possible to control the range of chainages to be processed on the branches, i.e. the tool will process selected branches in their entirety.
· Table of reaches: The locations where new cross sections may be generated are specified in a table, offering flexible options to control the branches to be included, and also the range of chainages for each branch, where the cross sections may be generated. Cross sections are generated only between the specified lowest and highest chainages, and if the box is checked in the 'Include' column. Furthermore, when using the 'DEM' option, the table allows to apply local 'Width' and 'Interval' values for each row of the table.
When the option 'Table of reaches' is used, the following buttons are available above the table:
· 'Import all': Imports all branches in the table, i.e. it creates one row for each branch in the model. Each branch is given its default lowest and highest chainages.
· 'Import from file': Imports the 'Branch name', 'Lowest chainage' and 'Highest chainage' from a text file. The file format is: three columns with lowest chainage, highest chainage and branch name (in this order), with one separate line for each row of the table. Columns must be space-separated or tab-separated.
· 'Include all': Checks all boxes in the 'Include' column of the table.
· 'Exclude all': Unchecks all boxes in the 'Include' column of the table.
· Generate: Generates cross sections following the specifications in the dialogue window.
· Save: Saves the messages issued during the generation of a text file.
· Clear log: Clears the log-messages in the text box above the buttons.
· Close: Closes the ‘Auto Generate Cross Sections’ tool.
![]()