
A number of simulated parameters can be selected for storage in an additional HD output result file (with the file name extension ‘.res1d’).
The parameters are saved for each save step at h/Q points of the river system, depending on each parameter. Time series and longitudinal profiles of the parameters can be viewed in the same way as normal MIKE 1D result files.
Following hydraulic variables can be stored in the additional HD output file:
Velocity
Velocities are calculated as the discharge divided by the flow area.
Discharge
The discharge calculated at h-points is a weighting of up- and downstream discharges calculated at Q-points.
Flow area.
The area of flow in the cross section. At computational h-points where no cross section is present the area is linearly interpolated from upstream and downstream h-points with cross section.
Flow width
The channel width at the free surface level.
Radius
The radius (resistance or hydraulic radius, according to the selected option for each cross section).
Resistance number
The cross-sectional resistance (resistance number multiplied by the resistance factor).
Conveyance
The conveyance.
Froude number
The Froude number is defined as:
Where F is the Froude number, Q the discharge, A the flow area, g the acceleration due to gravity and bs the flow width.
Flooded Area
At h-grid points: The flooded area of the water surface between two neighbouring Q-points. This area is equal to the flow width at the h-point multiplied by the distance between the closest upstream and downstream Q-points.
Total: The total surface water area for the river system.
Volume
At H-grid points: water volume calculated around the H-grid points.
Total: total water volume for the river system.
Time step
The time step applied during simulation can also be stored. This is in particular useful when Adaptive time step has been applied as the output will then present as a timeseries which time step has been applied throughout the simulation.
Mass Error
this wil save four items per calculation points; inflow volume, outflow volume, water volume change and the mass error, where the inflow and outflow volumes are volume entering or leaving a calculation box. The mass error is defined as the difference between the volume calculated in the model and the true volume based on a step-wise integration of processed data for the actual h-point. At nodal points with more than two connections the mass error is distributed uniformly between each connection.
Total: The total mass error for the river system.
Accumulated Mass Error
The sum of the ‘Mass error’ in time and space. Generally, the mass error can be reduced by increasing the number of iterations per time step, reducing the time step, and or by increasing the resolution of the cross-sections.
Total: total accumulated mass error for the river system.
NOTE! Some cross-sections may cause mass-balance problems due to abrupt and large changes in cross section profile definition. These problematic cross-sections can be detected by selecting the mass error item calculated for each grid point.
Energy level
Energy level at water level points.
Energy level slope
Energy level slope at discharge points.
Bed shear stress
The bed shear stress t at water level points given as
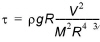
where r is fluid density, g the acceleration of gravity, M the Manning number, R is the radius (approximated equal to the flow depth, h) and V is the flow velocity.
Some variables at grid points where structures are located can also be stored in the additional output file.
Flow Velocity
Velocity in each individual structure. Velocities are calculated as the discharge through the structure divided by the flow area
Discharge
Discharge in each individual structure
Flow area
Flow area in each individual structure

Note: when multiple structures are defined at the same location, results are presented for each of these. The additional results are therefore useful to analyse e.g. the flow distribution between the different structures.
Note: When a gate is modelled, the computed gate level is automatically saved along with the active control rule number. When a dambreak is modelled, the results in the breach are automatically saved in a text file named ‘DAMBREAK_<Dambreak ID>.txt’.
Variables
All user-defined variables specified for the Control module will be saved.
![]()