Cross sections can be edited and shown graphically in the Map view and in the Tabular view, but the data are stored in an external cross section file with the extension xns11.
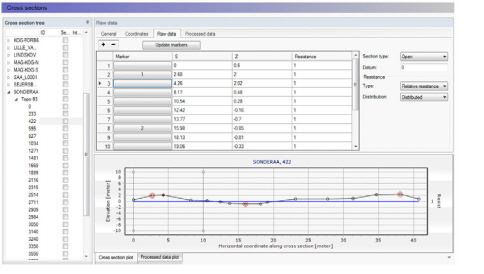
When working from the Tabular view, the numerical data and the plots are presented under a number of windows, as shown on in Figure 6.4.
Figure 6.4 Tabular view for the Cross sections menu

Note: Although it is possible to edit the cross sections data from MIKE HYDRO, it is also possible to edit the cross section file from the cross section editor (from ‘File \ Open \ File’). This will open the cross section file as it is saved to the disk and will not contain unsaved changes made in MIKE HYDRO. The cross section editor will not automatically refresh if you save cross section changes from MIKE HYDRO while the cross section editor is opened. If editing cross sections both from MIKE HYDRO and from the cross section editor it is recommended to close the cross section editor each time changes are made from MIKE HYDRO, or use the ‘Refresh’ option available in MIKE HYDRO in the ‘General’ tab of the cross sections menu.
Inserting a cross section in Map view
To insert a cross section from the map select the ‘Add’ button in the Cross sections ribbon in the Map view (see Figure 6.5).

Figure 6.5 Map view ribbon for adding and editing cross sections
Cross sections are defined as polylines. To add a new cross section line click firstly on the required location of the bank on one side of the river and then click at all locations of intermediate points of the polyline. To stop digitising the cross section, double-click at the location of the bank on the other side of the river. The digitised cross section must always intersect with a branch. The branch name and chainage defining the location of the cross-section are automatically defined by this intersection. The created cross section is automatically shown in the Cross Section window.

Note that inserting a cross section on the map will set marker 1 in the point located to the left of the branch (taking the branch direction into account), marker 3 in the point located to the right of the branch and marker 2 where it crosses the branch.
If a DEM has been added to the map the cross section is defined based on the DEM values along the digitised cross section, and using the digitisation options available in the ‘Digital Elevation Model’ menu. If a DEM is not added to the map a default cross section is created with the horizontal extent corresponding to the digitised cross section.
Cross sections that are drawn on the map will automatically be created with coordinates for each digitised points, linking them to the position specified. The use of these coordinates can be disabled in the Tabular view.

Note: Cross sections with coordinates are fixed at the given location. This means that the chainage of the cross section used in the calculation may differ from the position shown on the map e.g. if the chainages have been edited after the cross sections have been drawn. Chainages may be updated using the tool 'Edit multiple cross sections'.
Extend. Select this icon to extend a cross section on its left and/or right side. This tool keeps the raw data along the original extent of the cross section unchanged, and adds additional data following the same principles as when adding a new cross section. That is, if a DEM is available the cross section is extended using the elevation data from the DEM. In the latter case, the number of points being added is controlled by the spacing between points as well as the maximum number of points specified in the 'Digital Elevation Model (DEM)' menu, where this maximum number of points corresponds to the total number of points in the extended cross section, including original points. When extending a cross section, markers 1 and/or 3 are moved to the new cross section's end, while marker 4 and/or 5 is assigned to the original end of the cross section (except if marker 4 and/or 5 was already assigned, in which case it's kept unchanged).
Edit. To edit a cross section on the map, select the ‘Edit’ icon on the ribbon and click once on the cross section on the map. The vertices of the polyline are then shown on the map, and you can click and drag these vertices to edit the location of the cross section. Clicking between two vertices will add a new vertex to the cross section.
Delete. Select this icon and click on a cross section on the map to delete it.
Plot. To display a cross section in the Cross Section window, select the ‘Plot’ icon and select the cross section to be displayed on the map.
![]()