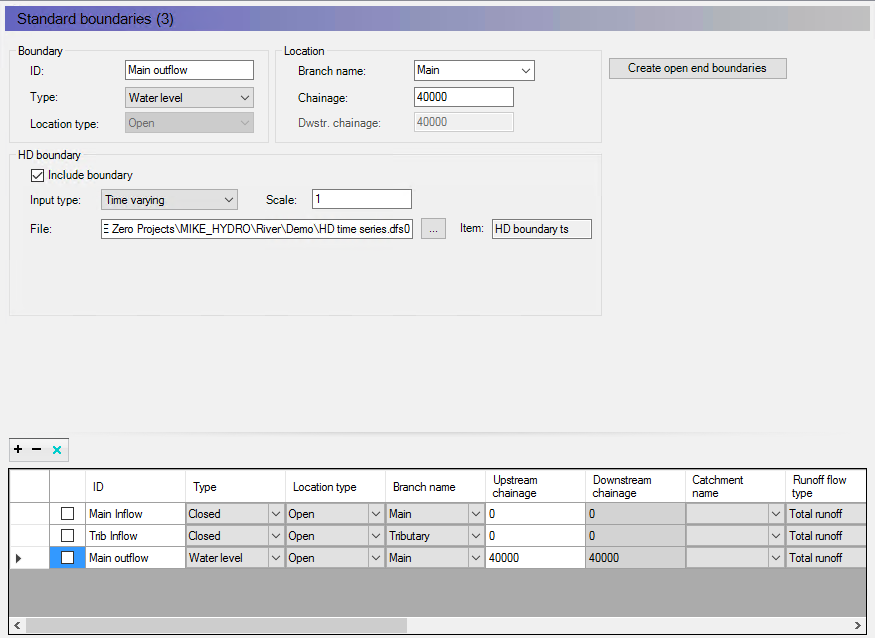
Every open end of a river branch (not connected to other branches) must have a boundary defined. Hence, in this example we must define boundaries for the upstream and downstream end of ‘Main’ and for the upstream end of ‘Tributary’. Here we will define the boundary condition at the upstream ends of both branches as closed (i.e. zero discharge) and define a varying water level between 5 and 6 meters at the downstream end.
From the Boundary ribbon in Map view, select ‘Add’ and create new boundary conditions at the upstream and downstream point of ‘Main’ and upstream end of ‘Tributary’ by locating the cursor on these locations and make a single mouse click. Change to Tabular view for additional boundaries details specification.
First specify the upstream boundary of the main branch. Highlight this boundary in the overview grid and set the Type to ‘Closed’, the branch name is ‘Main’ and adjust the chainage to 0.00 if a different value is present from the map definition. Now specify the upstream boundary of the tributary the same way as for main.
Finally, you need to specify the varying water level boundary with a time series file. As part of the boundary definition ist o create a timeseries file used at this downstream boundary. In the HD Boundary select the Input Type to be ‘Time varying’. Press the file action button ‘...’ and select Create a new file and specify the time series properties in the opening page. Press Create file to create the empty timeseries file and make a reference to it in the File field for the boundary. Secondly, use the file action button ‘...’ and select Edit in Timeseries Editor where timeseries values and dates can then be inserted.
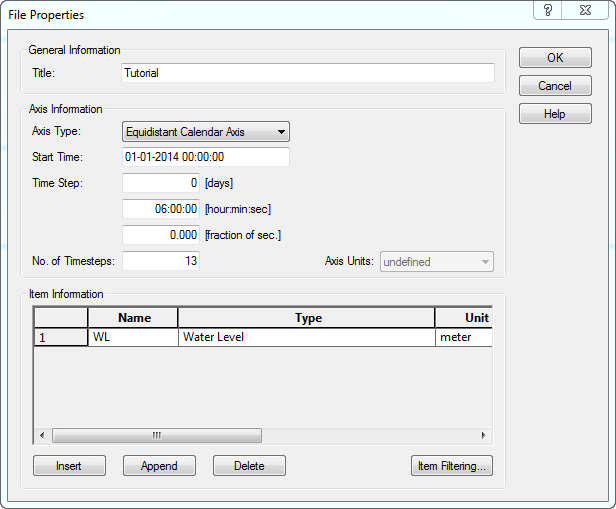
Alternatively, it is possible to make a new Timeseries file through the MIKE Zero menu bar and choose ‘File’ - ‘New’ - ‘File’. Select the MIKE Zero product type and the document ‘Time Series (.dfs0)’. In the first shown dialogue window select to create a blank time series and in the following specify the data as shown in Figure 3.8.
Figure 3.8 Define new dfs0 file
Once the ‘OK’ button is pressed the time variation of the water level can be entered as shown in Figure 3.9.
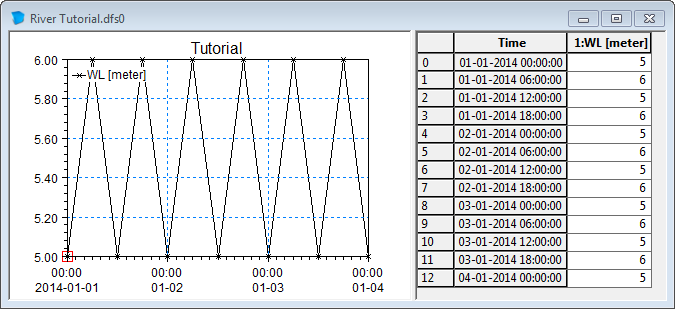
Figure 3.9 Define time series data
Save the file together with your setup.
Close the time series window and put focus on the boundary editor again. Create a new line in the upper grid and set the boundary description to ‘Open’, the boundary type to ‘Water Level’, branch name to ‘Main’ and the chainage to 40000. In the lower part set the TS Type to TS File and click the ‘...’ button to choose the dfs0 file created earlier.
![]()