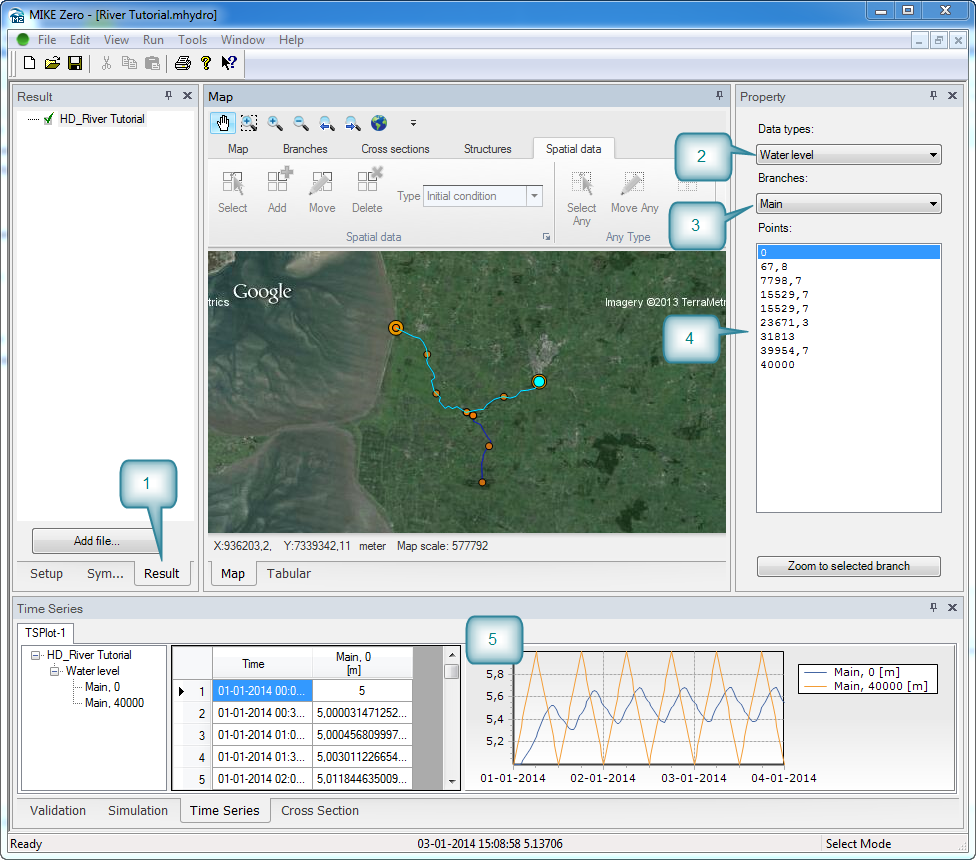
When the simulation has finished the results are automatically loaded and the focus is shifted to the ‘Result’ tab in the Tree view.
On the right side choose to plot water level in the main branch by setting the drop-down menus in the Property view. Double-click in the point list on the first and last chainage and they are added to a plot in the Time series window.
Figure 3.12 Viewing results
![]()