Comparison with MIKE 21 results
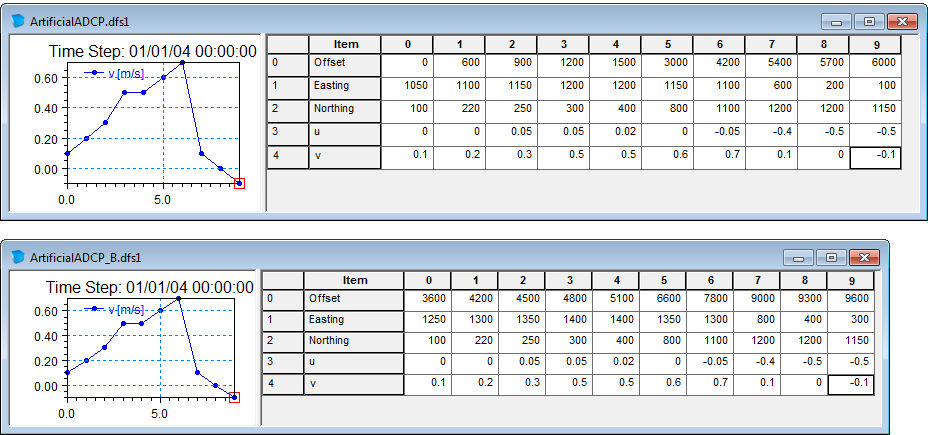
Two simple ADCP track data files with artificial user defined values has been generated for a simple corner example, where currents have been generated using MIKE 21 HD by slowly raising the water level at the south boundary. The track data files are shown in Figure 6.5. The two track files are almost identical: In the first file (Track A) the initial data correspond to the start of the simulation (offset = 0), whereas in the second file (Track B) the track data has been shifted in one hour in time and 200 m to the east.
The left figure in Figure 6.6 shows the Track A data compared with the derived velocities from the background HD result file. Notice that the derived velocities for the first ADCP measurements are low, corresponding to the short time from the start of the HD simulation (offset = 0).
The right figure in Figure 6.6 shows the Track B data compared with the derived velocities from the background HD result file. Because the ADCP measurements in this case are defined as beginning with an offset of one hour from simulation start, the derived velocity vectors are larger, illustrating fully developed flow
Figure 6.5 ADCP track file with user-defined data
Upper: Track data A, Lower: Track data B
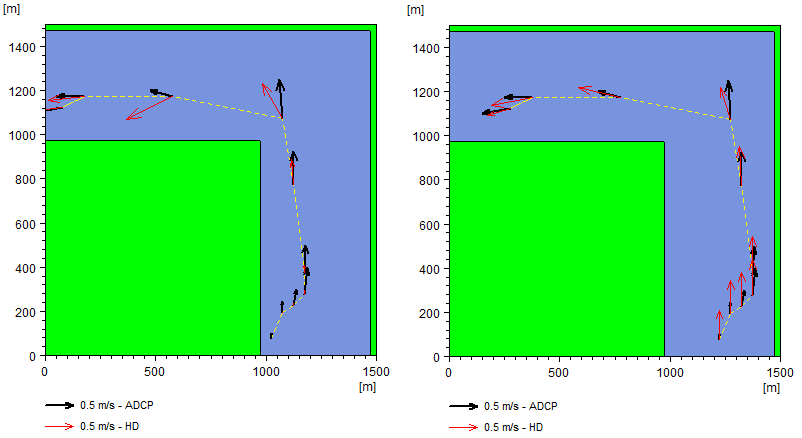
Figure 6.6 ADCP track files compared to HD simulation results
Left: ADCP track file A, Right: ADCP track file B
Figure 6.7 shows the two tracks in the same plot. Note that the derived vectors from the HD simulation are using the offset value from the ADCP data file to find the related time step values in the HD result file.
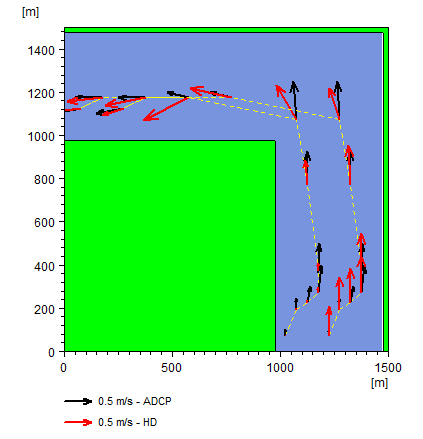
Figure 6.7 ADCP track files A and B compared to HD simulation results
![]()