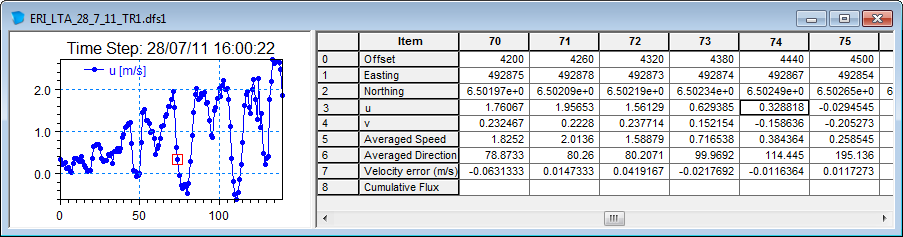
A moving vessel has carried out measurements every minute for a few hours to illustrate the currents through a straight. The measured transect data file is shown in Figure 6.3.
The sailing path and corresponding measurements are illustrated in Figure 6.4 using a dfs2 bathymetry file as background to specify the domain.
Figure 6.3 ADCP track file of measured currents
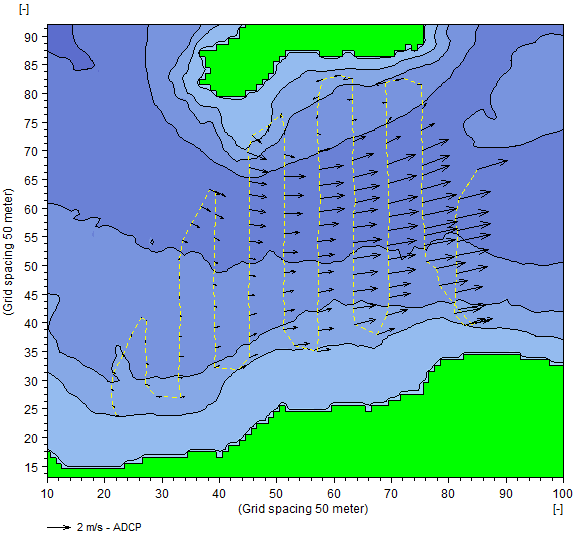
Figure 6.4 ADCP plot showing ADCP data on top of bathymetry
Yellow stippled line: sailing path
Black arrows: Measured current speed
![]()