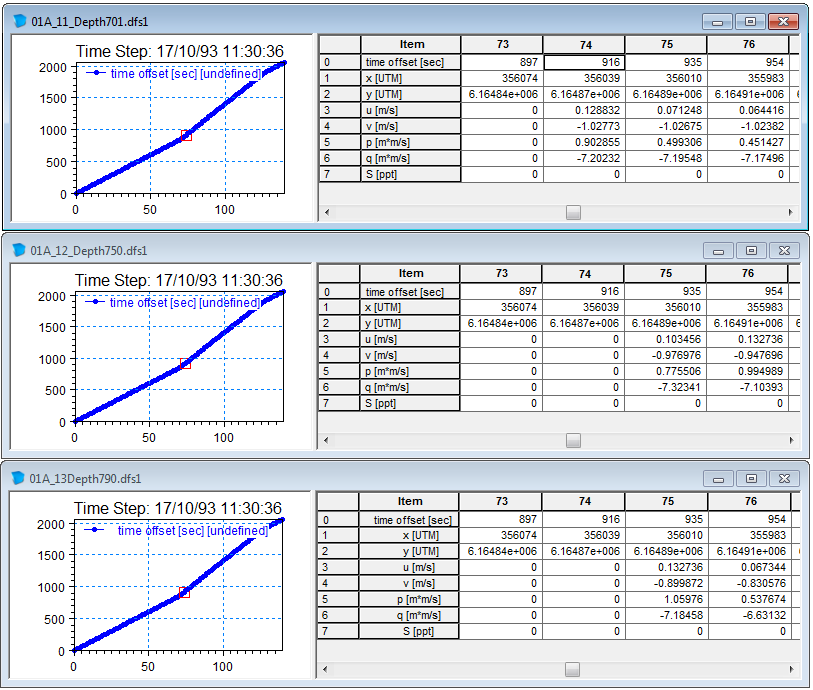
A moving vessel has carried out measurements approximately 5 times a minute to illustrate the currents through a straight. Measurements were carried simulatenously in three levels and the measured transect data files are shown in Figure 6.8.
The sailing path and corresponding measurements are illustrated in Figure 6.9 using a dfs2 surface level variation file as background to specify the domain area and the background values. The sub-series time step is selected to represent the conditions at the approximate time of the measurements. The land contours are defined from an ascii xyz file with land border coordinates.
In the start the vessel moved without recording velocity data. Note that when the measurements started (offset=916 s), only velocities in the upper level was recorded. At the next offset point recordings were made at all three levels. This is illustrated in Figure 6.10 where the first recording point only shows one ADCP vector whereas the next recording points shows 3 ADCP vectors each, representing the three recording levels. Notice also the slight variations in current vectors for the same recording point, but measured at different levels.
Figure 6.8 ADCP track measurements in three levels
Upper: measurements at level -7.05 m
Middle: measurements at level -7.50 m
Lower: measurements at level -7.90 m
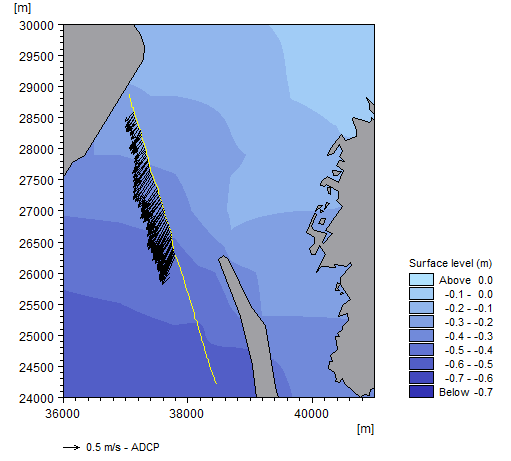
Figure 6.9 ADCP plot showing ADCP data for three levels on top of simulated surface level.
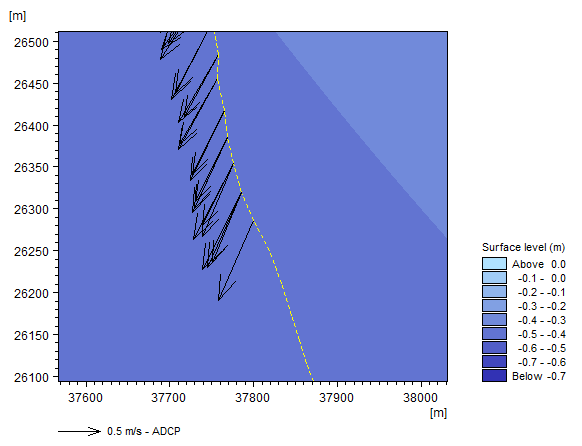
Figure 6.10 Detail of Figure 6.9. Note the difference in number of ADCP vectors at each recording point and the slight variation of velocity vectors for the different levels at a single point.
![]()