The WS Crossing Analysis module is a generalisation of the classical zero-crossing analysis. For a predefined threshold, the input time series item is divided into events, each of which is defined by the time series value crossing the reference level in upwards (or downwards) direction.
For each event, the following properties can be determined:
· Peak to peak value
· Crossing level to crest
· Crossing level to through
· Zero to crest
· Zero to through
· Standard deviation within event
· Crossing time
· Duration (period) of event
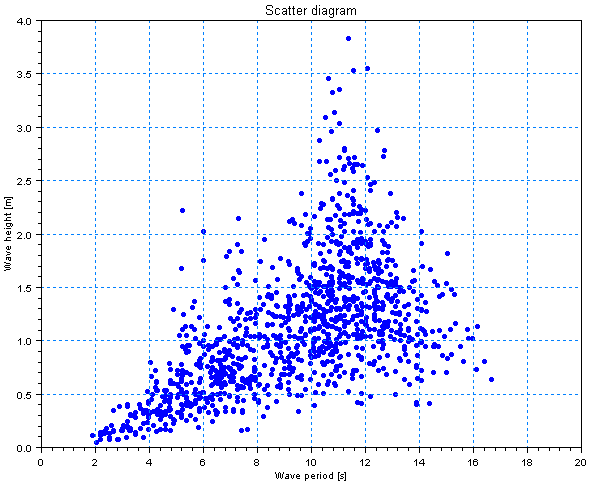
The properties of the detected events may be presented directly by scatter diagrams or processed further, e.g. fitting to a given probability distribution or establishment of histograms.

Figure 6.1 Scatter diagram for wave heights and periods detected within a time series acquired during a physical model test
To eliminate false crossings caused by low-level measurement noise it is possible to define a crossing filter. A threshold level and a threshold period define the crossing filter. Hence, the threshold level defines a small amount by which the reference level must be exceeded before the beginning of an event is accepted. Correspondingly, the threshold period defines a duration that must be exceeded before the event can be accepted.