In the Output File dialog you specify the output file name and folder where to place the data files.
For dfs2-type input data following parameters are calculated at each grid point:
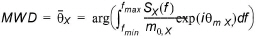
· mean wave direction, MWD
· mean directional spreading, DSD
· significant wave height, Hm0
· mean wave period, T02
· spectral peak period, Tp
· x-component of Hm0 (i.e. Hm0 cos(MWD))
· y-component of Hm0 (i.e. Hm0 sin(MWD))
The calculation of mean wave direction and spreading complies with the suggestions and definitions given by Frigaard et al. (1997).
The definitions are:
· Mean wave direction
(5.2)
· Mean directional spreading
(5.3) 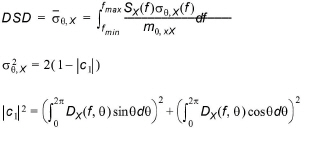
· Significant wave height
(5.4) 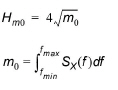
· Mean wave period
(5.5) 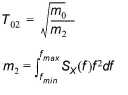
· Spectral peak period
(5.6) 
where fp is the frequency corresponding to the maximum spectral density.
You may choose to open the log file after model execution.
![]()