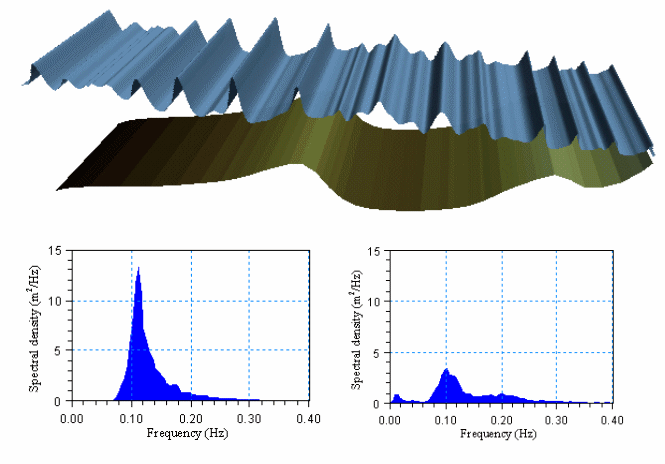
With the WS Linear Spectral Analysis module it is possible to perform linear frequency domain analyses based on the Fast Fourier Transform (FFT) of time series data. Hence, it is presumed that the time series is a superposition of an infinite number of infinitesimal amplitude waves with uniformly and randomly distributed phases (Goda, 1985).
The module provides the following spectra:
1. Auto spectrum
2. Cross spectrum (amplitude and phase)
3. Cross spectrum (real and imaginary parts)
4. Frequency response spectrum (gain and phase)
5. Coherent power spectrum
6. Coherence spectrum
The auto and cross-spectra, which correspond to the second moment of the time series, are used for generation of the remaining spectra. Spectra 2 through 6 are dual analyses and require two sets of time series data. For spectra 4 and 6 it is furthermore necessary to distinguish between input and output time series as the order makes a difference.
The analysis is based on the methods and definitions described in Bendat & Piersol (1986 and 1993).
The spectral analysis can be applied to data from:
· Physical model tests
· Field measurements
· Numerical simulations

Figure 3.1 Transformation of irregular non-linear waves over a natural barred beach profile (upper panel) - simulations made by MIKE 21 BW. Offshore (left) and onshore (right) frequency wave spectra (lower panels) estimated by WS Linear Spectral Analysis module