You specify which type of integral spectral parameters to be calculated. The estimates are saved in the log file, which as default is automatically opened after execution.
Spectral moments
Peak parameters
Spectral width
Peak-to-peak estimates
Period estimates
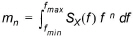
The first four spectral moments are calculated. The spectral moment is defined as
(3.2)
where  is auto spectrum and f frequency.
The spectral peak frequency fp is the frequency corresponding to the maximum spectral density.
The spectral peakedness factor Qp is defined as
(3.3) 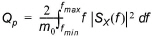
Qp describes the peakedness of a wave spectrum. Qp is infinity for a single or extremely narrow-banded spectrum and is unity for a white noise spectrum
The spectral width (or broadness) parameter is defined as
(3.4) 
The significant wave height is defined as
(3.5) 
The wave height with exceedance probability of p is defined as
(3.6) 
where p is set to 10%, 1%, 0.1% and 0.01%.
The peak wave period Tp defined as
(3.7) 
where fp is the frequency corresponding to the maximum spectral density.
The mean wave period T01 defined as
(3.8) 
The mean wave period T02 defined as
(3.9) 
The mean wave period T24 defined as
(3.10) 
![]()