In the case of local sensitivity analysis the result file contains the following:
· The parameter set and corresponding output measures and objective functions for the point where the local sensitivity analysis has been performed.
· Scaled sensitivity coefficients for each parameter of the specified output measures and objective functions.
· Parameter covariance matrix in terms of the standard deviations of the parameters and the correlation matrix. It should be noted that the calculated parameter covariance is related to the transformed parameter values and not their native values.
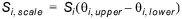
In order to compare the local sensitivity coefficients between parameters of different scales of magnitude scaled sensitivity values are calculated as
(1.21)
where Si is the calculated un-scaled sensitivity coefficient described in Section Local sensitivity analysis, and qi,upper and qi,lower are the specified upper and lower limits of the parameter.The scaled sensitivities provide a ranking of the parameters with respect to the importance of the parameters for the considered output measure or objective function. Higher scaled sensitivity values (absolute values) indicate more sensitive parameters.
As a rule of thumb, parameters are said to be insensitive if their scaled sensitivity value is less than about 0.01-0.02 times the maximum scaled sensitivity value (absolute value). However, care should be taken using this as a strict threshold measure. Since the sensitivity coefficients are evaluated only around the initial parameter set, they reflect the local sensitivities only. At other locations in the parameter space the sensitivity coefficients may be very different, especially if the simulation model is highly non-linear in its parameter-output interaction.
![]()