MIKE Hydro River Detailed Time Series
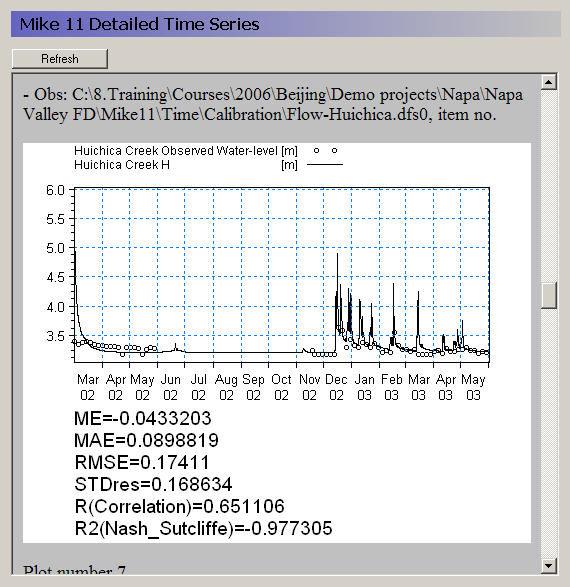
The MIKE Hydro River Detailed time series tab includes an HTML plot of each point selected in the Setup Editor. The HTML plots are updated during the simulation whenever you enter the view. Alternatively, you can select the Refresh button to refresh the plot.
For information on the statistics see Statistic Calculations (V1 p. 369).
![]()