Run statistics can be generated in HTML format for a MIKE SHE simulation. The run statistics table information can be copied and pasted directly into any word processing program, such as Microsoft Word, or spread-sheet, such as Microsoft Excel. The Run Statistics HTML document includes MIKE SHE and MIKE Hydro River results for all Detailed Time Series items that have observation data.
To calculate Run Statistics for a simulation, navigate to the Results Tab and the Run Statistics item on the menu tree. Press the Generate Statistics button on the Run Statistics window to perform the statistical calculations. For some simulations with long simulation periods and/or a lot of calibration data it can take a while to generate the run statistics.
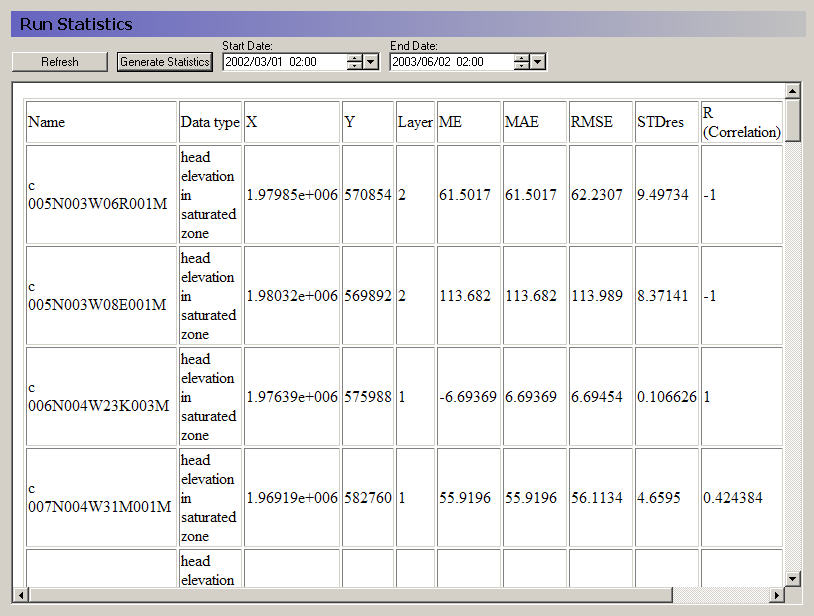
After successful completion of the Generate Statistics phase, the Run Statistics HTML document will be displayed in the window on the Run Statistics page (see below).
.
Similar to the detailed time series output, the Run Statistics can be viewed during a simulation. Press the Refresh button on the Run Statistics page to update the Run Statistics using the most recent model results during a simulation
For information on the statistics see Statistic Calculations (V1 p. 369).
Shape file output for run statistics
A shape file of statistics is also generated when the html document is generated. The shape file contains all of the information contained in the HTML document and can be used to generate maps of model errors that can be used to evaluate spatial bias. The shape file is created in the simulation directory and is named ProjectName_Stat.shp where ProjectName is the name of the *.she file for the simulation. Note: the Run Statistics shape file does not have a projection file associated with it and this file should be created using standard ArcGIS methods.
The statistics contained in the HTML document and the shape file are calculated using the same methods used to calculate statistics for the detailed time series output. The reader is referred to the Detailed Time Series Output section for more information on how the statistics are calculated.
![]()