There are a number of visualisation tools within the MIKE Zero environment. Some are common for all models and some are focused on visualising data from certain models. For the following tools some examples are shown in Figure 4.19 - Figure 4.23:
· Plot Composer
Creates various types of plots based on time series data, line series data and 2D/3D data.
· Data Viewer
Display data from MIKE Zero flexible mesh models.
· Result Viewer
Display model results from a various range of DHI models, including MIKE 11.
· MIKE Animator Plus (Add-on module)
Display data and create animations using a 3D view.
· MIKE to Google Earth (tool)
Display and animate dfs2 and dfsu data files in Google Earth
Common for all visualisation tools are the graphical display settings described below.
Palette
Grid settings
Image Manager
Overlay Manager
Background maps
Animation
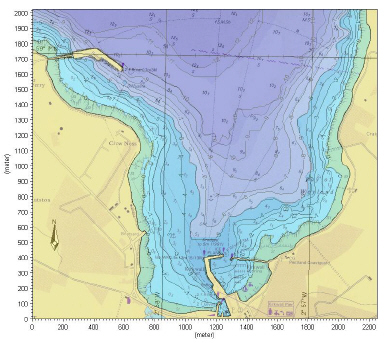
Figure 4.19 Plot Composer: using grid plot to display isolines, color contours and background layer (Kirkwall Marina)
Figure 4.20 Data Viewer: showing mesh grid, bathymetry values and color legend (Odense Fjord)
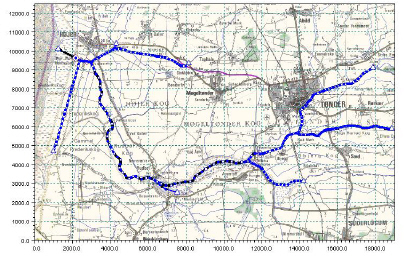
Figure 4.21 Result Viewer: showing MIKE 11 setup and background layer (Vida)
Figure 4.22 MIKE Animator Plus: 3D display of bathymetry data (Oresund region)
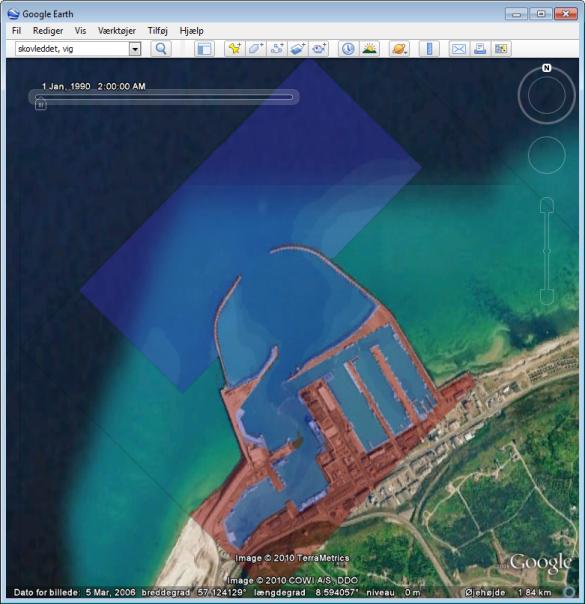
Figure 4.23 MIKE to Google Earth: showing dfs data in Google Earth (Hanstholm harbour)
![]()