Process verification
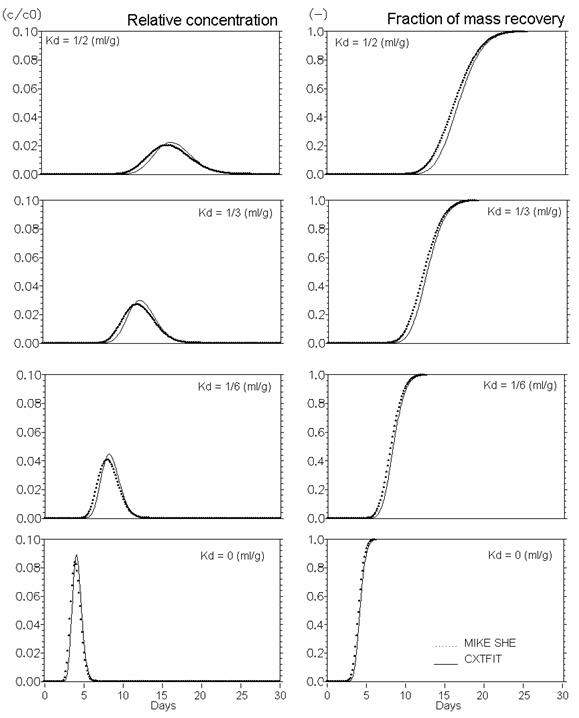
The performance of MIKE SHE’s basic reactive transport module, with equilibrium and non-equilibrium sorption and degradation, has been verified against analytical solutions calculated with CXTFIT (Toride et al., 1995). The verification tests were conducted using steady-state saturated water flow through a 1 m deep column discretised in 5 cm elements. The simulations were run for one month with maximum time step equal to 15 min. Pore flow velocity was 25 cm/day, the dispersivity was 1 cm and the bulk density was 1.5 g/cm3. Furthermore, the diffusion process in fractured media with a fracture porosity of 0.25 and a matrix porosity of 0.05 is verified both without and with sorption.
The verification results confirm that the numerical solutions are satisfactory, since the calculated solute breakthrough and mass recovery curves are very similar to the analytical solutions.
Figure 34.5 Linear equilibrium sorption. Effect of Kd (ml/g)
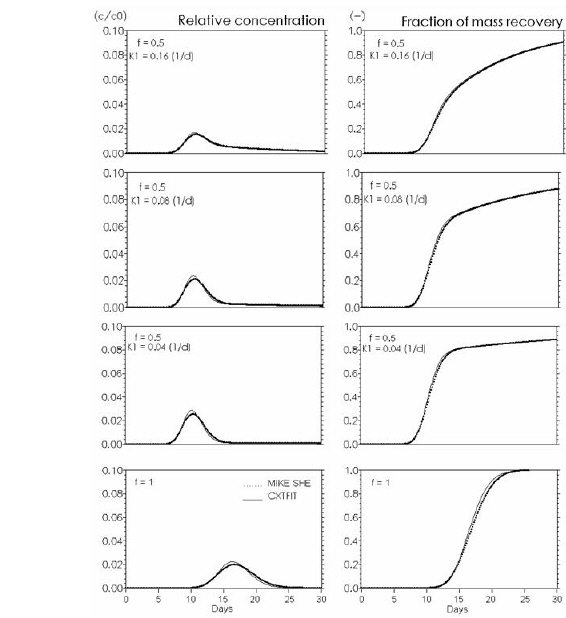
Figure 34.6 Kinetic sorption . Effects of rate constant K1 (d-1) in Eq.(34.9). Input to CXTFIT: f (fraction of equilibrium sorption sites). Kd = 0.5 ml/g. Input to MIKE SHE: Kd = f*Kd (CXTFIT). At f=1 the function is reduced to equilibrium sorption with Kd = 0.5 ml/g.
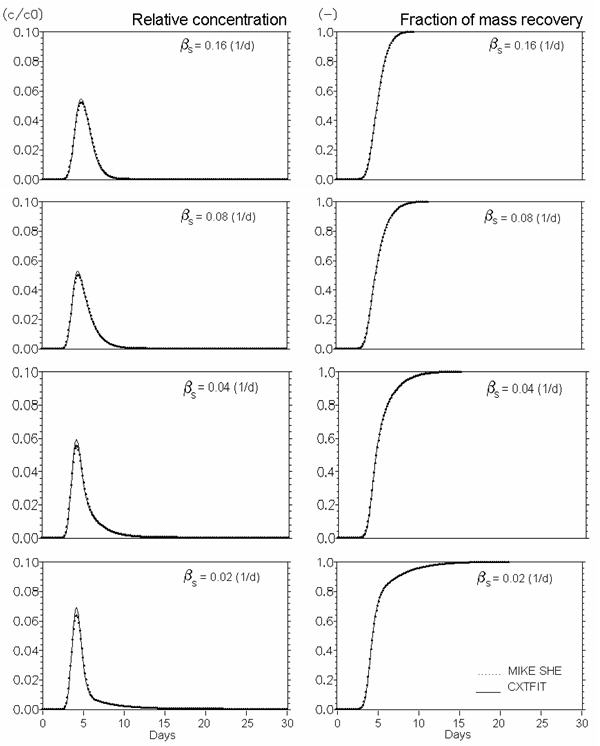
Figure 34.7 Conservative solute transport in dual porosity systems. Mobile porosity = 0.25, immobile porosity = 0.05. Effect of mass transfer coefficient (bs in Eq. (33.16) (d-1)).
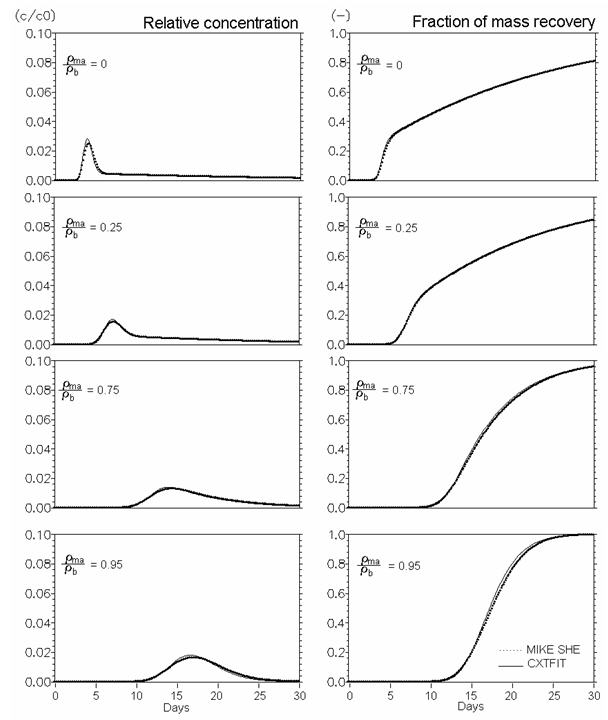
Figure 34.8 Verification of reactive solute transport in dual porosity systems. Mobile porosity = 0.25, immobile porosity = 0.05. Effect of distribution of sorption sites between mobile and immobile regions (rma/rb Eq. 47) (Kd = 0.5 ml/g, mass transfer coefficient (bs) = 0.08 d-1).
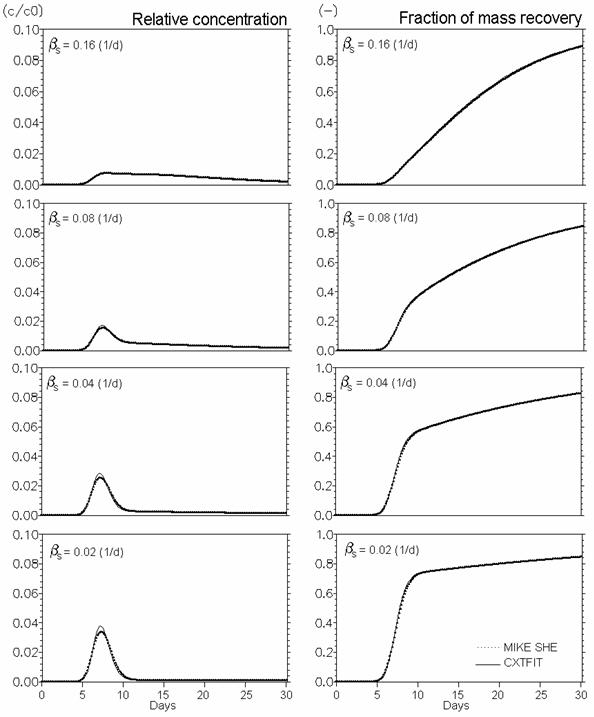
Figure 34.9 Verification of reactive solute transport in dual porosity systems. Mobile porosity = 0.25, immobile porosity = 0.05. Effect of mass transfer coefficient (bs in Eq. (33.16) (d-1)). Kd = 0.5 ml/g, rma/rb = 0.25 (Eq. (34.10)).
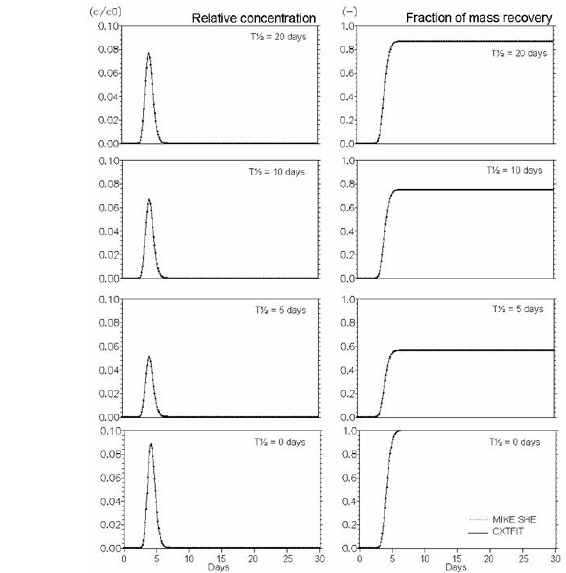
Figure 34.10 Verification of the description of first order degradation. Effect of half life time - T½ (L) (days) (Eq. (34.12)).
![]()